I first saw a reference to this data on the interestingNews, in Datasite.
Also, unlike column charts, they can handle way many more data points without becoming cluttered.
The example up top actually plots 3 more years of data, going back to 1999.
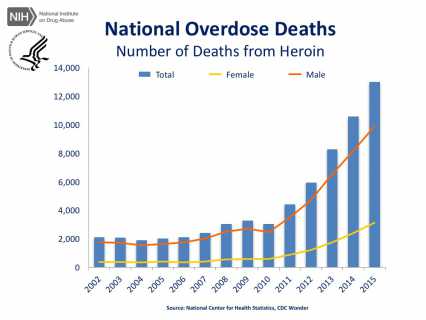
It would be interesting to show the average street price of heroin during this same period.
If you have a source for that data, let me know in a comment below.
