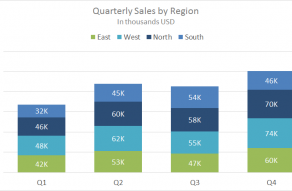
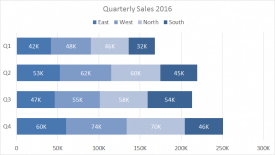
In a stacked column chart, data series are stacked one on top of the other in vertical columns.
Stacked column charts can show change over time because it’s easy to compare total column lengths.
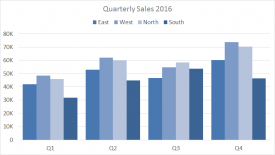
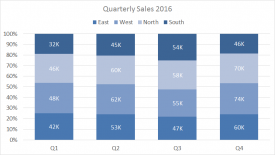
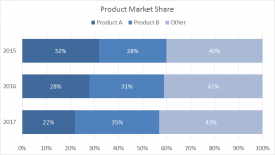
As categories or data series are added, stacked column charts quickly become complicated.
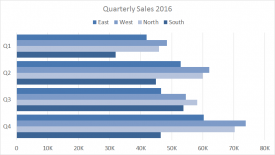
Stacked column charts can work well when the number of data series and categories is limited.