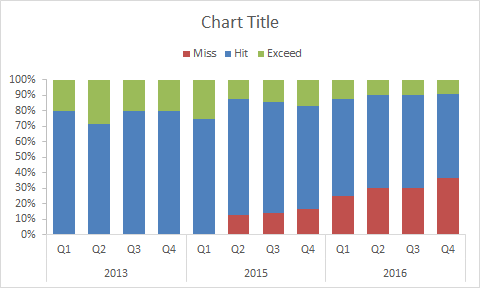
This chart is an example of a 100% stacked column chart. The data shown in the chart represents projects over a three year period, categorized as hit goals, missed goals, and exceeded goals. I think this is a good example of how a 100% stacked column chart can work well to show trends over time, in this case highlighting the worrying trend of more projects with missed goals. The data used to plot the chart looks like this:
April 14, 2025 · 1 min · 26 words · Joel Williams
Table of Contents
This chart is an example of a 100% stacked column chart.