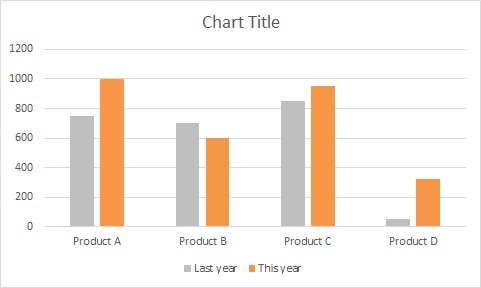
Bar and column charts are great for comparing things, because it's easy to see how bar lengths differ. This chart is an example of a clustered column chart showing product units sold this year versus last year. The data used for this chart looks like this on the worksheet:
April 14, 2025 · 1 min · 24 words · Nicole Wright
Table of Contents
This chart is an example of a clustered column chart showing product units sold this year versus last year.