This is an example of a 100% stacked area chart.
This tricky chart throw in can be quite hard to read.
In this case, data labels are only used to display the series name.
So, what can you see with this chart?
Primarily, you could see that sales of Retrobags are collapsing while Organic Flannel makes up the slack.
Hammocks and Banjo Packs are relatively stable.
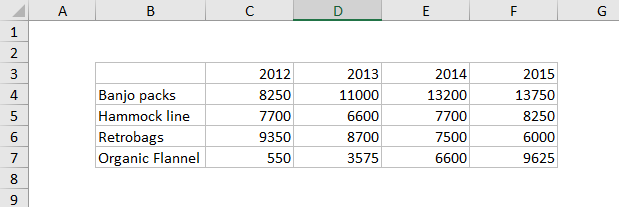
The data used to plot this chart looks like this:
How to create this chart


