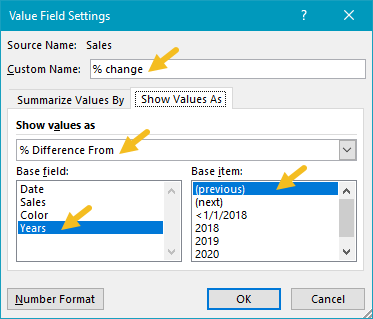
In this example, a pivot table shows the year-over-year variance in sales for each month of the year.
Change can be displayed as the numeric difference or as a percentage (this example).
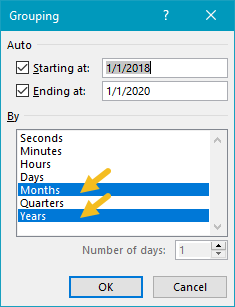
The Original “Date” field is configured as a Row field, which breaks down sales by month.
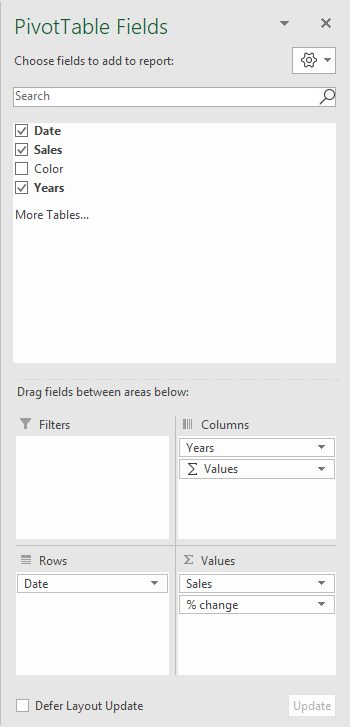
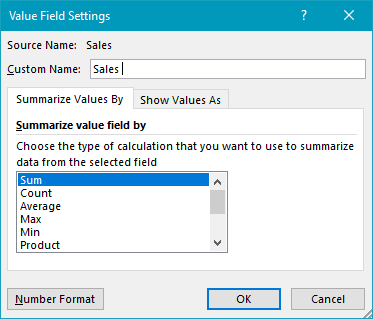
The Sales field has been added to the Values field twice.
It has been hidden to streamline the report.
Steps
Notes