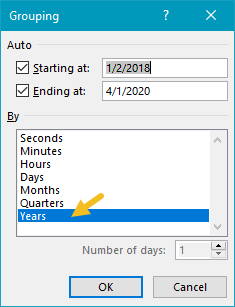
Pivot tables have a built-in feature to group dates by year, month, and quarter.
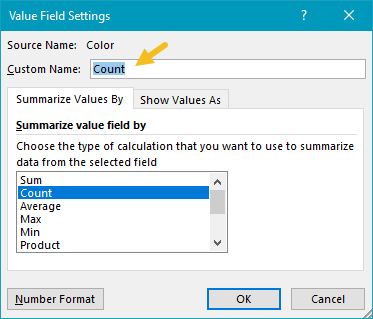
In the example shown, a pivot table is used to count colors per year.
This is the number of records that occur for each color in a given year.
Fields
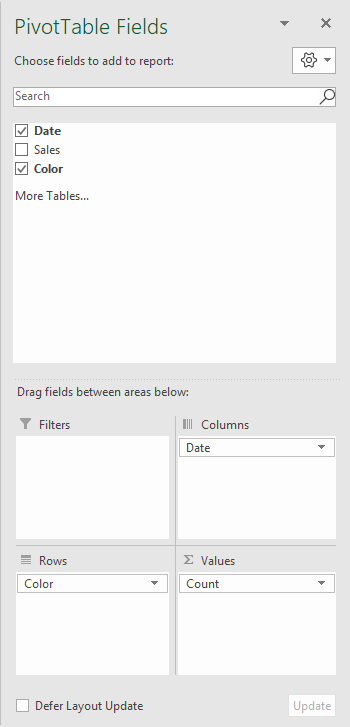
The source data contains three fields: Date, Sales, and Color.
Only two fields are used to create the pivot table: Date and Color.
The Color field has been added as a Row field to group data by color.
Then add the Year field to the pivot table directly.
Steps
Notes