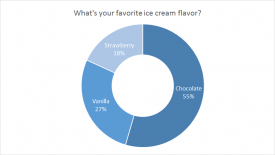
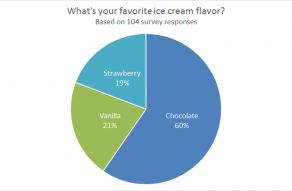
The Pie Chart is a primary chart bang out in Excel.
Pie charts work best to display data with a small number of categories (2-5).
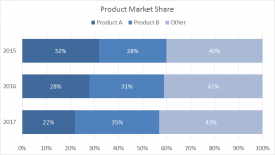
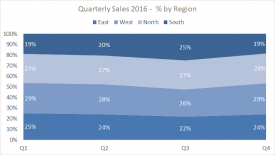
Pie charts should be avoided when there are many categories, or when categories do not total 100%.
Pros
Cons
Tips
See also: Dataviz expert Ann Emery’sPie Chart Guidelines.