NORM.S.DIST expects Standardized Input
NORM.S.DIST expects standardized input in the form of az-score value.
Cumulative Flag
Thecumulativeflag determines which distribution function is used.
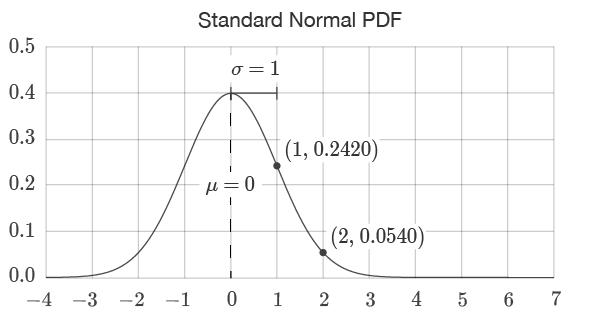
If the flag is set to FALSE, the standard normal PDF is used.
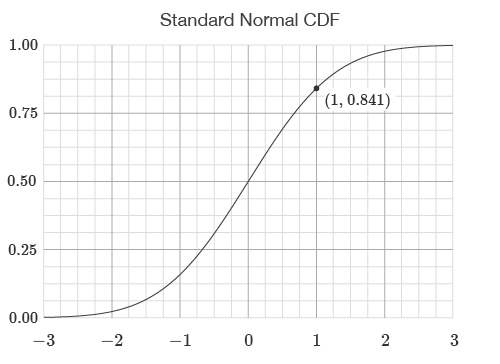
If the flag is set to TRUE, the standard normal CDF is used.
The output of the CDF corresponds to the area under the PDF to the left of a threshold value.
The output of the CDF represents the likelihood of an event occurring below an input value.
When thecumulativeflag is set to FALSE, the standard normal PDF is used.
The output of the CDF corresponds to the area under the PDF to the left of a threshold value.
For example, with an input of 1 and thecumulativeflag set to FALSE the return value is 0.242.
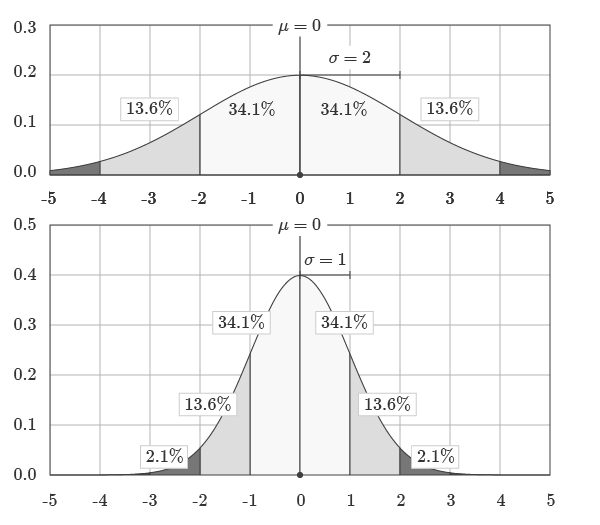
The standard deviation represents how spread out around the distribution is around the mean.
Probability density functions model problems concerning continuous ranges.
For example, the probability of a student scoring exactly 93.41% on a test is very unlikely.
This is shown in the graphic below:
Images courtesy ofwumbo.net.
The PDF returns the values of points on the curve.
The CDF returns the area under the curve to the left of a value.