The output of the function is visualized by drawing the bell-shaped curve defined by the input to the function.
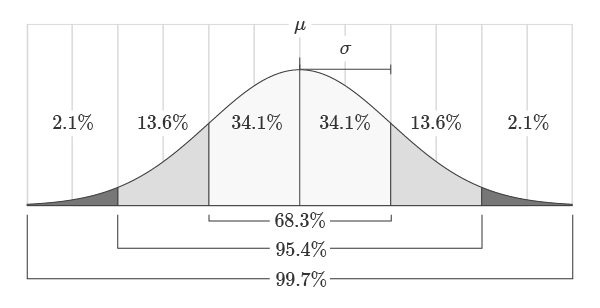
The mean represents the center or “balancing point” of the distribution.
Thestandard deviationrepresents how spread out the distribution is around the mean.
For example, 68.3% of the area will always lie within one standard deviation of the mean.
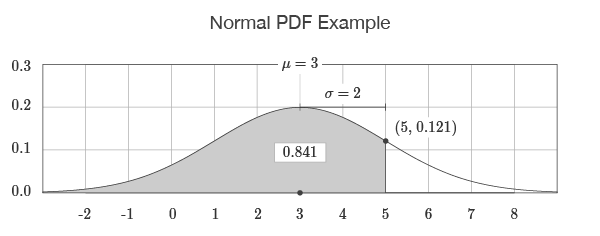
Probability density functions model problems over continuous ranges.
The area under the function represents the probability of an event occurring in that range.
For example, the probability of a student scoring exactly 93.41% on a test is very unlikely.
Related functions
NORM.S.DIST Function
NORM.INV Function