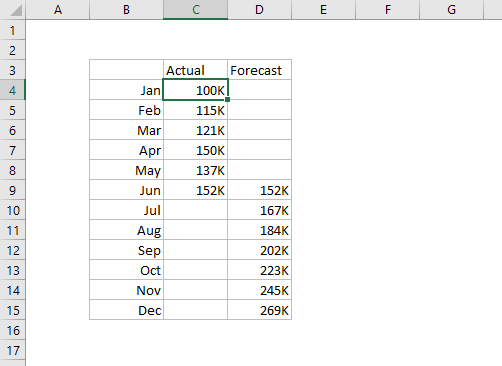
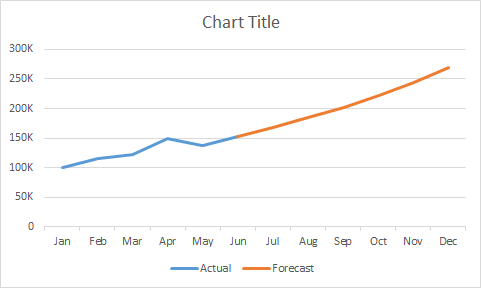
This chart shows actuals so far in a solid line with forecast numbers in a dashed line. The chart type is set to line chart, and actual and forecast values are plotted as two data series. The data used for the chart is set up as shown below:
April 14, 2025 · 1 min · 17 words · Christopher Cooke
This chart shows actuals so far in a solid line with forecast numbers in a dashed line.