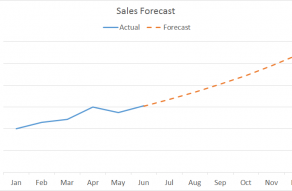
Line charts are a good way to show change or trends over time.
Line charts can be customized to show or hide data markers of various shapes and sizes.
The data itself is daily stock market information for Microsoft Corporation over a period of more than 30 years.
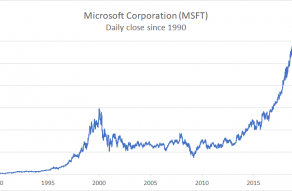
Only the closing price is plotted.