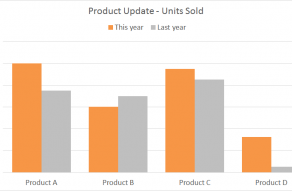
A clustered column chart displays more than one data series in clustered vertical columns.
Each data series shares the same axis labels, so vertical bars are grouped by category.
Clustered columns allow the direct comparison of multiple series, but they become visually complex quickly.
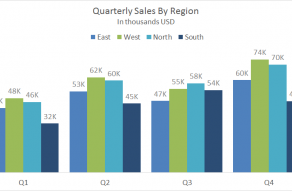
They work best in situations where data points are limited.
This chart is an example of a clustered column chart showing product units sold this year versus last year.