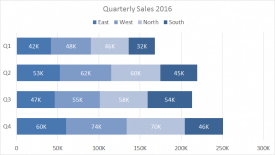
A clustered bar chart displays more than one data series in clustered horizontal columns.
Each data series shares the same axis labels, so horizontal bars are grouped by category.
They work best in situations where data points are limited.
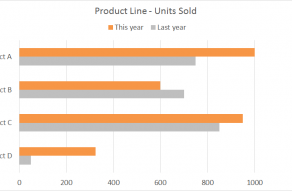
This chart is an example of a clustered bar chart showing product units sold this year versus last year.