This article is for those of you who don’t get pivot tables.
They can be that way.
I’m not going to mince words.
If you use Excel on a regular basis, you oughta know how to use pivot tables.
I’ll get to some good reasons below, but first, a quick story.
You gotta love corporate America.
Looking for good tips?
See23 things you should know about pivot tables.
What’s this got to do with pivot tables?
Yes, let’s get to that.
The remaining staff were not, as you might expect, completely trusting of the company at that point.
Beyond ordinary chaos, there was a deep current of fear running through the office.
People thought it was just a matter of time before the axe dropped on them.
More on that in a minute…
In the meantime, of course, there was work to do.
And we had lots of jobs already in progress.
No CRM system, no way to forecast sales, no project tracking app, nothing.
And, a few months later, that’s just what I did.
Pivot tables give you answers
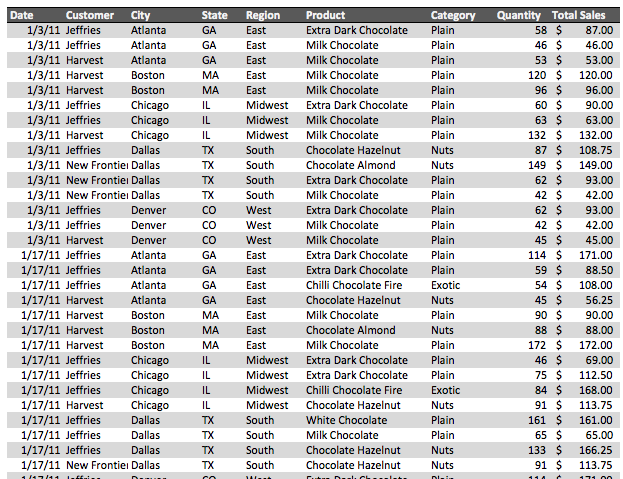
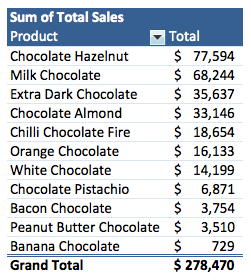
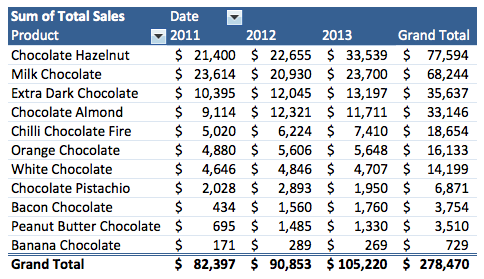
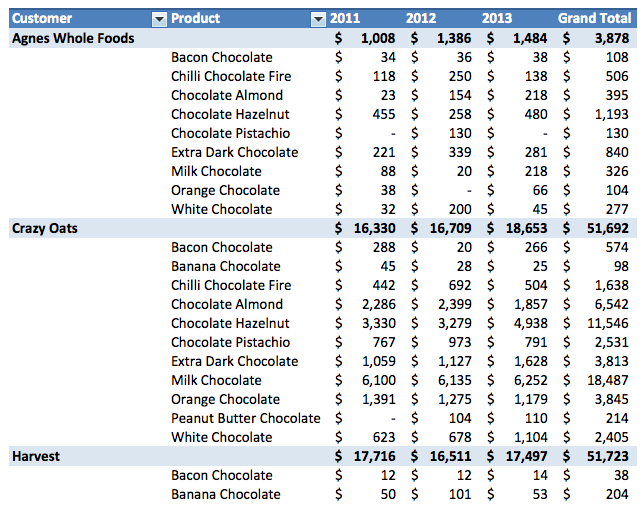
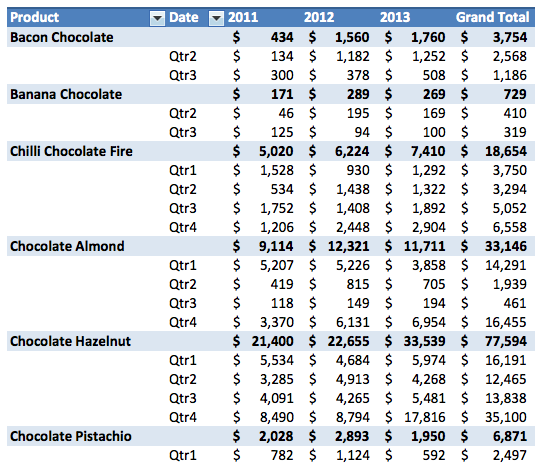
At the most basic level, pivot tables answer important questions.
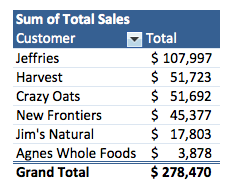
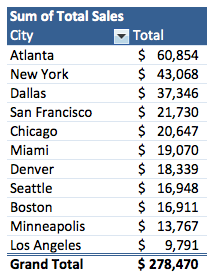
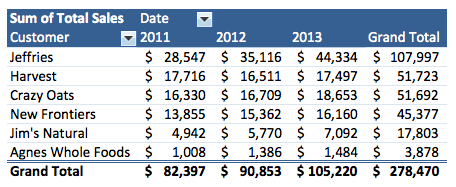
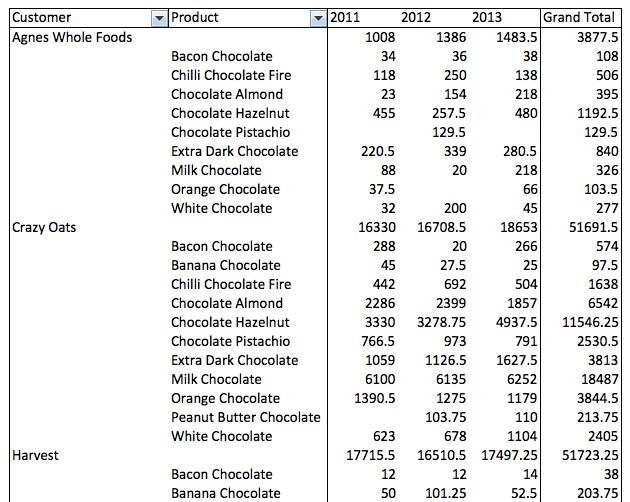
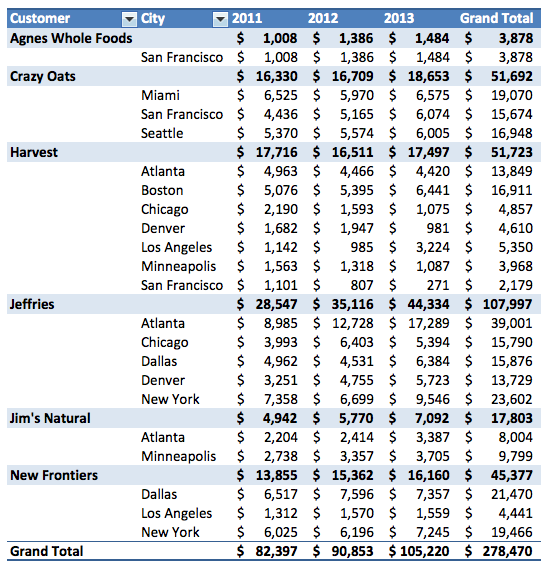
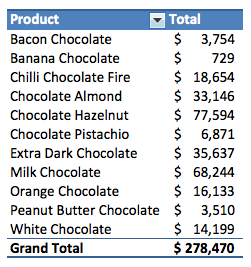
Each table presents a different view of the same data, so they all sum to the same number.
So, first and foremost, a pivot table can help you answer questions you have about your data.
And in Excel, there is no better tool for this job.
Yes, it’s true.
If you have the formula chops to do it,you couldcreate those same reports manually.
However, it’s going to take you a lot more time.
With expert skills, he manually builds a basic summary of product sales by region.
He concludes:
It took 77 clicks or keystrokes.
Then, he contrasts this with a pivot table approach: a few clicks and done.
Watch the video below to see a side-by-side demo of formulas versus pivot tables.
No matter how fast you are in Excel, a pivot table will beat you every time.
Pivot tables don’t require formulas
That’s right.
Pivot tables don’t require any formulas at all.
Not just a few formulas, butzeroformulas.

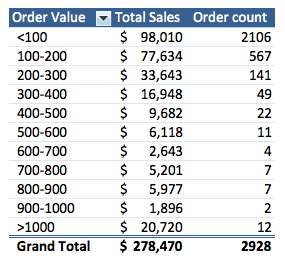
To illustrate how truly powerful this is, let’s do something really hard with our pivot table.
That is, we want to see a breakdown of all sales small and large orders.
In a couple of minutes, we have a breakdown of orders by order total.
Now, consider the formulas it would take to create this kind of report manually.
Believe me, they aren’t going to be pretty.
Even if you eventually work it out, you won’t understand what they do after a few weeks.

Which brings us to our next point.
If so, you’re not alone.
These kinds of errors happen all the time, even to pros.
Perhaps you read about thespreadsheet mistake that may have impacted the global economy?
It was a basic error.
A formula that was supposed to average values for twenty countries only averaged values in 15 countries.
So, how does this relate back to pivot tables?
Your only job is to confirm the source data is correct.
The pivot table takes care of the rest.
When you work with pivot tables, Excel handles 100% of the calculations and formatting for you.
Pivot tables are different.
All of the formatting they apply is clean and automatic.
A pivot table allows you to experiment fluidly.
you might quickly try out different layouts until you find what you need.
In fact, for just this reason, pivot tables are an awesome prototyping tool.
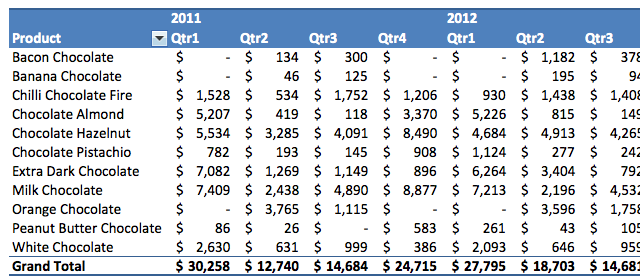
Maybe quarters would work better in rows?
Pivot tables are an excellent prototyping tool.
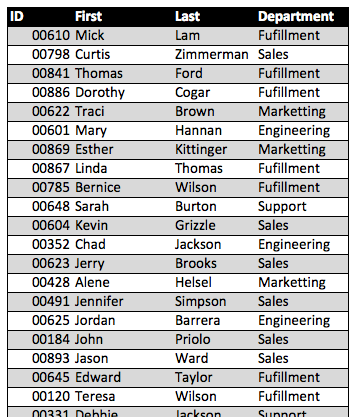
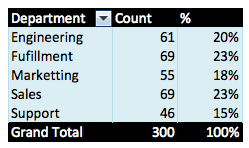
you’re free to use a pivot table to analyze any kind of tabular data.
A minute later, here’s your breakdown by department.
Let’s look at another example.
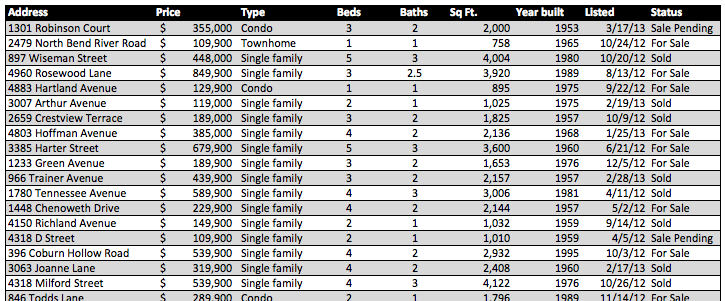
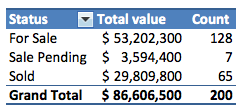
Maybe you work in residential real estate and export a list of 200 properties in a certain location.
You also want to see the total value of these properties.
30 seconds later, you’ve got your summary:
Do you see the pattern?
You start off with raw data, most likely collected by a system of some kind.
the things you should probably know.
Pivot tables are easy to update
In the real world, data is always changing.
Unlike most other tools in Excel, pivot tables do not update automatically.
This sometimes puzzles new users.
They make a change in the source data, check the pivot table, and…nothing.
To update a pivot table, you’re gonna wanna refresh the data.
To illustrate, let’s go back to the property-listing example.
To upgrade your report, here’s what you do.
First, you paste over the data you collected previously.
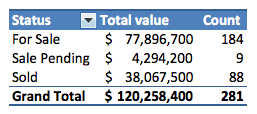
Next, you refresh your pivot table, and you’re done.
All changes in the data will be reflected in the pivot table, without any work on your part.
As the single most powerful feature in Excel, they help you do the following:
Oh yeah.
During that time, I had to downsize almost every quarter.
By the time that was done, I was the last person from the original office still around.
I won’t say that pivot tables saved my job.
It’s not quite that simple.
But I do think they played a big role.
Without them, I couldn’t have done it.
Want to learn more about pivot tables?
