This article describes one way to model Adwords profitability in Excel.
If you want to try out the spreadsheet, it’s attached below.
Just like those word problems from your school days, the key is setting up the problem correctly.
A quick Adwords primer
Adwords is Google’s primary advertising service.
When people search for things on Google, they use certain keywords.
For example, they might search for “best todo list manager” or “japanese survival knife”.
With Adwords, advertisers can bid on specific keywords.
If a user clicks on an ad, the advertiser pays Google the amount of the bid.
If a user doesn’t choose the ad, the advertiser pays nothing.
If you get less than one sale per 100 clicks, you’ll lose money.
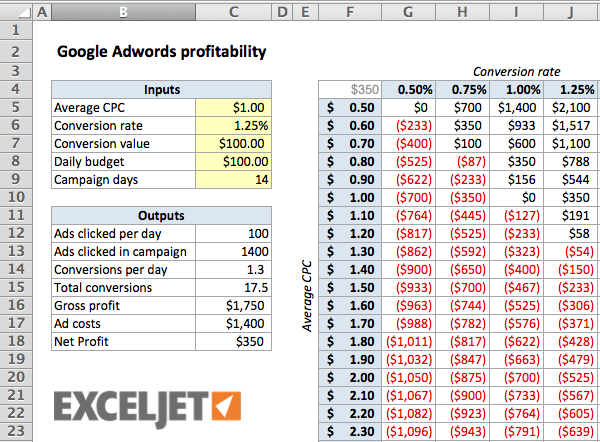
As usual, there is more than one way to skin the cat with Excel.
However, the modest Data Table turns out to be a pretty good way to visualize the problem.
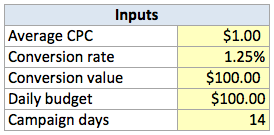
I like to group inputs together and label them in one area of the worksheet.
For this problem, we’ll have:
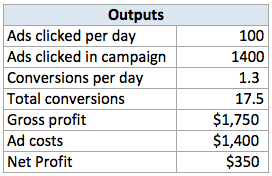
Now, we need to add an Outputs area.
This is an area on the worksheet where will fire off the main calculations with fixed inputs.
But we don’t want to do that manually.
We want Excel to do the hard work for us!
Enter the Data Table.
Data Tables can handle either 1 or 2 inputs.
Credits: This model was inspired by an example inJohn Walkenbach’sexcellent book,Excel 2010 Bible.