I just want to give you some ideas about how you could use pivot tables with your own data.

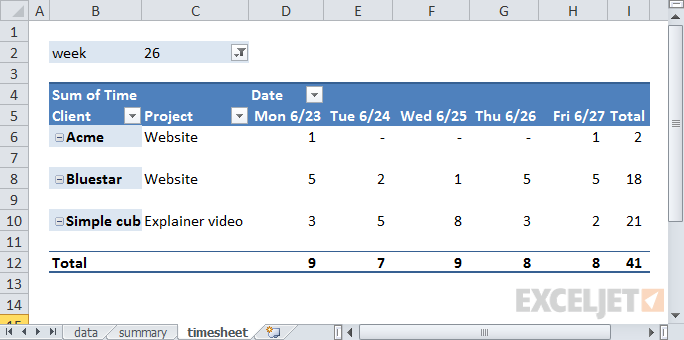
First, you might want an overview of your time by week.

The website is a portal that provides product information to partners.

Simple time tracking data by client and project

You open up the data and take a look.

There are more than 30,000 users in there!

The data looks something like this:

Lots of user data.

Simple time tracking data by client and project

Emails are fictitious, of course!

Your boss wants to know some basic information: how many users are currently active?

How many users are being created each month?

Simple time tracking data by client and project

What partners have the most user accounts, and so on?

Also, she’s meeting the CEO at lunch.

Can you get that info to her in the next hour?

Simple time tracking data by client and project

First, active vs. inactive users.

Some users are “suspended”.

Next, the top 10 partners by number of active users.

Simple time tracking data by client and project

This is easily done by using the pivot tables built-in “Top 10” value filter.

Once again, this is an easy job for a pivot table.

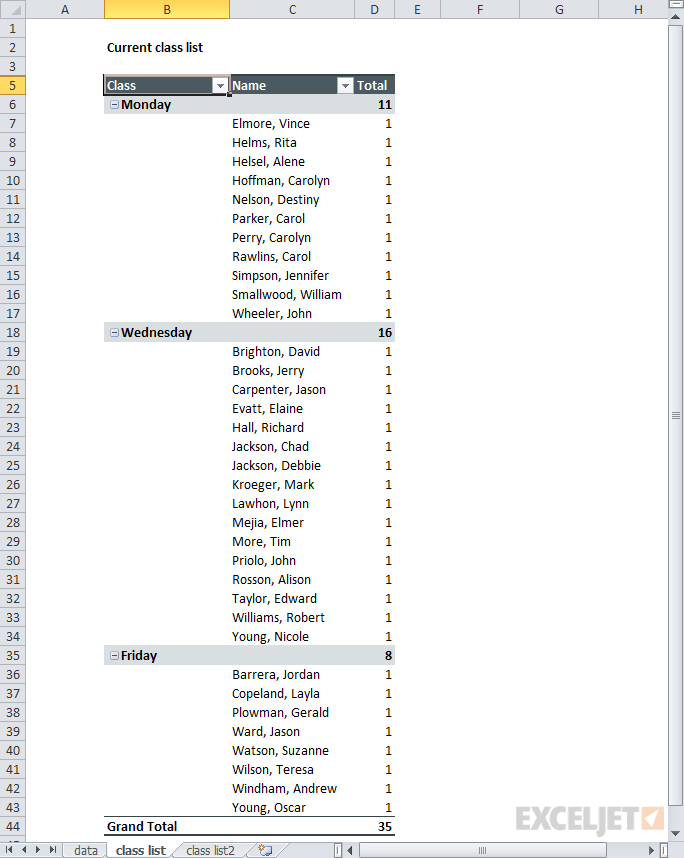
Just build a simple pivot table that summarizes by class day:

35 people have registered so far.

A summary of time by week number

Only 8 for the Friday class.

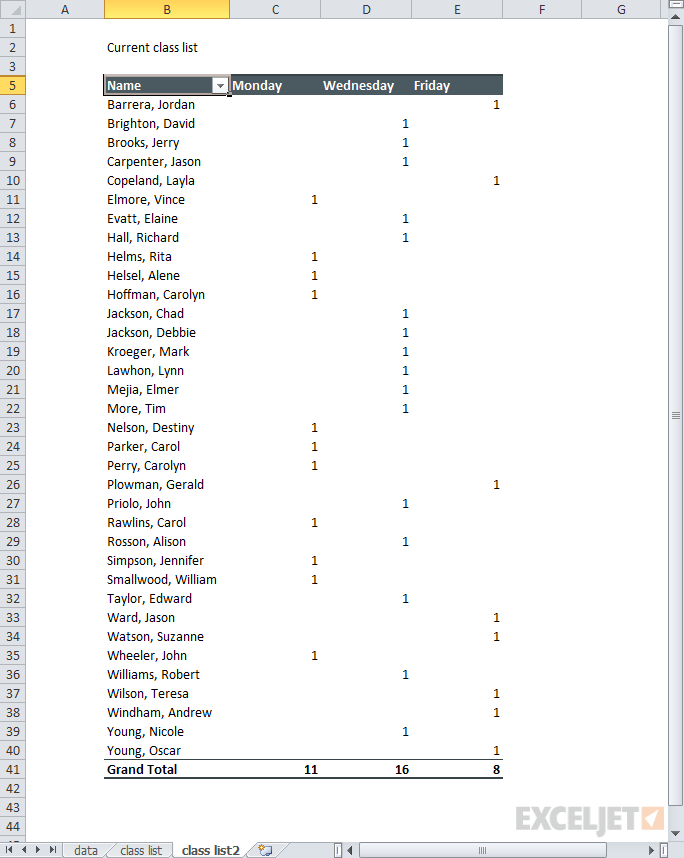
By adding names, you’re free to quickly create a full class list.

One Pivot Table quirk is a tendency to want to counteverything.

A summary of time logged for one week

Now that you’ve got a report layout you like, how do you update the report each day?

This should take less than a minute, with no busy work.

Yes, you could create formulas to do this, but it will be a lot of work.

Raw server data showing user account details

In addition, you add conditional formatting to make the higher and lower percentages stand out.

Below, we’ve used green for higher percentages, and blue for lower percentages.

Now it’s clear: most sign-ups are on weekdays.

A simple summary of all users by status

Tuesdays and Wednesdays are especially good days.

Here are a few more helpful links and resources:

The top 10 partners by number of active users

The number of users created by year and month

This data shows which students have registered for which class

A summary of current class registrations

Pivot table: Current class registrations with student names

Pivot table: Current class registrations all students in alphabetical order

Raw data: instrument readings taken every two minutes

Pivot table: instrument readings averaged by hour

Raw data: email signups with day of week added with a formula

Pivot table: email signups by year, month, and day of week

Pivot table: email signups by year, month, and day of week by percent, w/ conditional formatting

Simple time tracking data by client and project

A summary of time by week number

A summary of time logged for one week

Raw server data showing user account details

A simple summary of all users by status

The top 10 partners by number of active users

The number of users created by year and month

This data shows which students have registered for which class

A summary of current class registrations

Pivot table: Current class registrations with student names

Pivot table: Current class registrations all students in alphabetical order

Raw data: instrument readings taken every two minutes

Pivot table: instrument readings averaged by hour

Raw data: email signups with day of week added with a formula

Pivot table: email signups by year, month, and day of week

Pivot table: email signups by year, month, and day of week by percent, w/ conditional formatting